Environmental Performance
- Energy consumption
- Greenhouse gas emissions
- Water consumption
- Waste emissions
- Notes on the Above Performance
Energy consumption
Actual results
| Item | 2023 | 2024 | 2025 | |
|---|---|---|---|---|
| Total energy consumption (thousand kWh) | 417,345※1 | 335,124※2 | 342,430※3 | |
| Fuel consumption (thousand kWh) | 58,343※1 | 53,517※2 | 53,647※3 | |
| Electricity consumption (thousand kWh) | 278,181※1 | 222,133※2 | 221,010※3 | |
| Other heat consumption (thousand kWh) | 80,756※1 | 59,438※2 | 67,738※3 | |
| Renewable energy self-consumption (thousand kWh) |
64※1 | 35※2 | 36※3 | |
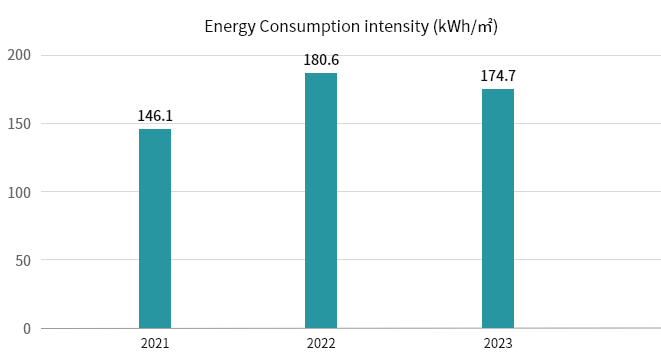
| Energy consumption intensity (kWh/㎡) | 174.7 | 179.5 | 180.6 | |
| Non-fossil fuel certificate utilization (thousand kWh) |
24,625 | 41,394 | 54,597 | |
Greenhouse gas emissions
KPI
| Item | Target |
|---|---|
| GHG emissions (Scope 1+2+3) | 90% reduction by 2050(Base year 2021) |
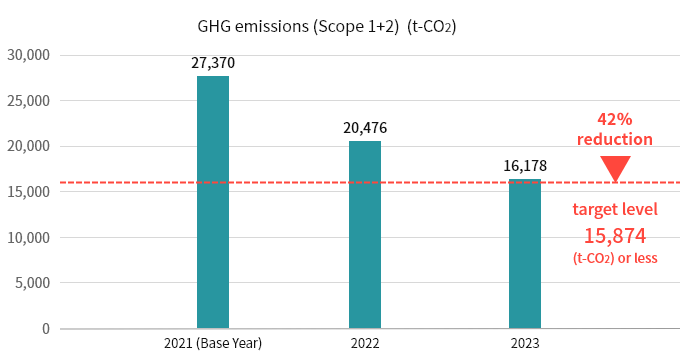
| GHG emissions (Scope 1+2) | 42% reduction by 2030(Base year 2021) |
Actual results
| Item | 2021 | 2023 | 2024 | 2025 |
|---|---|---|---|---|
| GHG emissions (Scope 1+2+3) (t-CO2) | 147,900 | 124,487 | 97,081 | 96,694 |
| Reduction rate of total amount (Comparison with base year) |
- | 15.8% | 34.4% | 34.6% |
| Item | 2021 | 2023 | 2024 | 2025 |
|---|---|---|---|---|
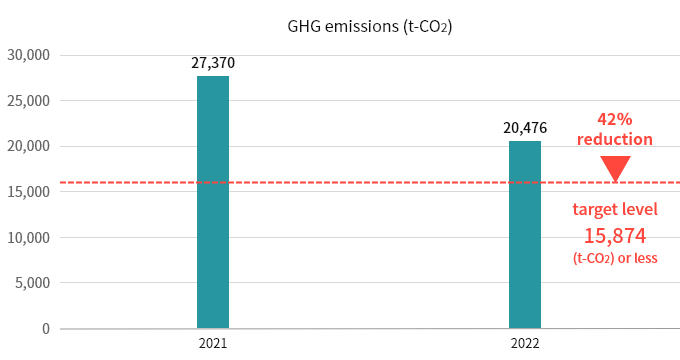
| GHG emissions (Scope 1+2) (t-CO2) | 27,370 | 16,178 | 7,924 | 7,011 |
| Reduction rate of total amount (Comparison with base year) |
- | 40.9% | 71.0% | 74.4% |
KPI
| Item | Target by 2030 |
|---|---|
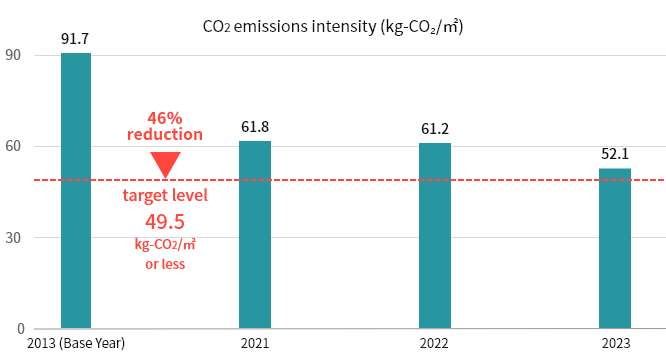
| CO2 emission intensity | 46% reduction (Base year 2013) |
Actual results
| Item | 2013 | 2023 | 2024 | 2025 | |||
|---|---|---|---|---|---|---|---|
| Total CO2 emissions (t-CO2): before deduction of Non-fossil fuel certificate | A= ①₊ ②a₊ ③a |
191,606 | 134,270※1 | 114,670※2 | 122,062※3 | ||
| Scope1 emissions (t-CO2) | ① | - | 4,354※1 | 3,897※2 | 3,724※3 | ||
| Scope2 emissions (t-CO2): before deduction of Non-fossil fuel certificate | ②a | - | 17,983※1 | 16,351※2 | 16,701※3 | ||
| Scope2 Non-fossil fuel certificate utilization (t-CO2) | ②b | - | 6,159※1 | 12,324※2 | 13,415※3 | ||
| Scope2 emissions (t-CO2): after deduction of Non-fossil fuel certificate |
②c | - | 11,824※1 | 4,027※2 | 3,286※3 | ||
| Scope3(category13) emissions: before deduction of
Non-fossil fuel certificate (t-CO2) |
③a | - | 111,934※1 | 94,422※2 | 101,636※3 | ||
| Scope3 Non-fossil fuel certificate utilization (t-CO2) | ③b | - | 3,624※1 | 5,266※2 | 11,953※3 | ||
| Scope3 (category13)emissions (t-CO2): after deduction of Non-fossil fuel certificate | ③c | - | 108,309※1 | 89,156※2 | 89,683※3 | ||
| Total Scope2,3 Non-fossil fuel certificate utilization (t-CO2) | B= ②b+ ③b |
- | 9,783※1 | 17,590※2 | 25,368※3 | ||
| CO2 emissions (t-CO2): after deduction of Non-fossil fuel certificate | C= A-B |
- | 124,487※1 | 97,081※2 | 96,694※3 | ||
| CO2 emissions intensity (kg-CO2/㎡)* | 91.7 | 52.1 | 52.0 | 51.0 | |||
| Reduction rate of intensity (Comparison with base year) |
- | 43.2% | 43.3% | 44.4% | |||
The details of Scope 1, 2, and 3 categories are as follows.
| Scope 1: | CO2 emissions associated with the use of fuel (city gas, bunker A, diesel oil) in properties excluding tenant-managed properties ("owner-managed properties"). |
| Scope 2: | CO2 emissions from the use of purchased electricity and heat (Electricity, cool water, warm water, steam, other hot water) in owner-managed properties. Emissions calculated based on tenants' energy consumption using the total floor area and tenants' exclusive area ("tenants' energy-derived CO2 emissions") are excluded from the calculation. |
| Scope 3: | CO2 emissions from tenant energy consumption. For owner-managed properties, the total floor area and exclusive area for tenants are used to calculate tenant energy-derived CO2 emissions. |
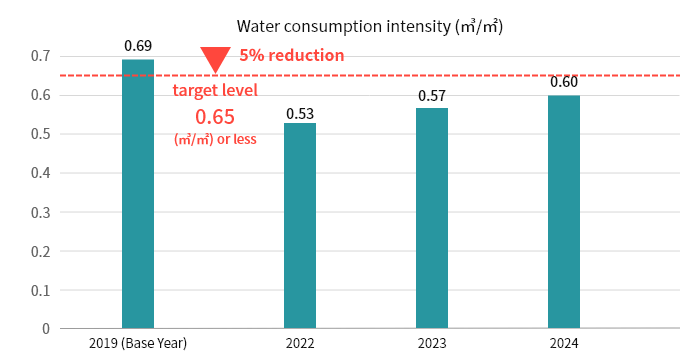
Water consumption
KPI
| Item | Target by 2030 |
|---|---|
| Water consumption intensity | 5% reduction (Base year 2019) |
Actual results
| Item | 2019 | 2023 | 2024 | 2025 | |
|---|---|---|---|---|---|
| Total water consumption (thousand ㎥):A+B | 1,752 | 1,549※1 | 1,257※2 | 1,301※3 | |
| Purchased water consumption (thousand ㎥):A | 1,571 | 1,361※1 | 1,113※2 | 1,164※3 | |
| Other water consumption (thousand ㎥):B | 181 | 187※1 | 144※2 | 137※3 | |
| Water consumption intensity (㎥/㎡): Subject to A |
0.69 | 0.57 | 0.60 | 0.61 | |
| Reduction rate of intensity (Comparison with base year) |
- | 17.3% | 13.6% | 11.6% | |
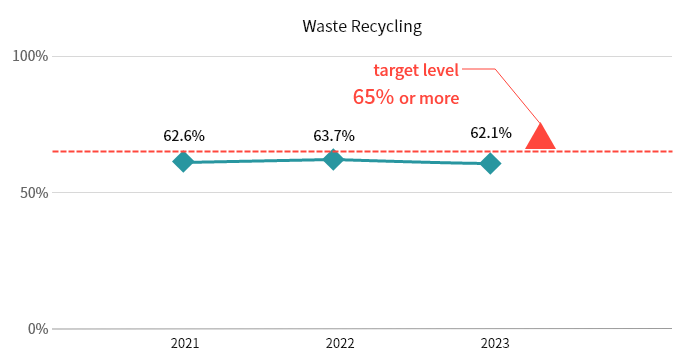
Waste emissions
KPI
| Item | Target by 2030 |
|---|---|
| Waste recycling rate | 65% |
Actual results
| Item | 2023 | 2024 | 2025 | |
|---|---|---|---|---|
| Total waste emissions (t) | 7,621 | 6,041 | 6,060 | |
| General waste emissions (t) | 5,959 | 4,545*Note1 | 4,618*Note2 | |
| Industrial waste emissions (t) | 1,661※1 | 1,496※2 | 1,441※3 | |
| Ratio by method of waste disposal | ||||
| Land filling | 3.6% | 4.2% | 4.6% | |
| Incineration | 32.9% | 33.5% | 33.9% | |
| Recycling | 62.1% | 60.8% | 60.3% | |
- Of the general waste emissions for 2024, a potion(2,335 t)are assured. The scope covered by the assurance is as described in” [Notes on the Performance] 3. Calculation method ④.”
- Of the general waste emissions for 2025, a potion(2,590 t)are assured. The scope covered by the assurance is as described in” [Notes on the Performance] 3. Calculation method ④.”
- We have received the independent practitioner’s assurance from Deloitte Tohmatsu Sustainability Co., Ltd. for "Nippon Building Fund Inc. 2023 Environmental Performance".
- We have received the independent practitioner’s assurance from Deloitte Tohmatsu Sustainability Co., Ltd. for "Nippon Building Fund Inc. 2024 Environmental Performance".
- We have received the independent practitioner’s assurance from Deloitte Tohmatsu Sustainability Co., Ltd. for "Nippon Building Fund Inc. 2025 Environmental Performance".
Notes on the Performance
1. Scope of data calculation
- In principle, all properties owned by Nippon Building Fund Inc. (the ”NBF”) during the period from January 1 to December 31, 2025 are covered.
- Calculations are made taking into account NBF's share in each property held.
- Regarding gas consumption, some data such as amount of city gas consumption, contracted directly by tenants, which is difficult to calculate, is excluded.
- Waste data for properties where building management is performed by tenants (NBF Osaki Building and NBF Ginza Street Building), are excluded.
- Portions that are difficult to aggregate, such as residential areas, are excluded from the data aggregation.
2. Calculation period
Calculation period: January 1st through December 31st 2025
3. Calculation method
- Energy consumption
Total energy consumption=Σ (consumption by energy type × heating value conversion factor × conversion rate for electricity)
Calculated by using the conversion factor based on the “Act on Rationalization of Energy Use and Shift to Non-fossil Energy”
Energy type: city gas, bunker A, diesel oil, electricity, cool water, warm water, steam, other hot water - Greenhouse gas emissions
Scope of greenhouse gas: Energy origin CO2
Energy origin CO2 emissions=Σ (energy consumption × CO2 emission factor)
The CO2 emission factors for fuel and other heat are based on the "Greenhouse Gas Emission Calculation and Reporting Manual” published by Ministry of the Environment and Ministry of Economy, Trade and Industry.- The definitions of Scope 1, 2, and 3
Scope 1: CO2 emissions associated with the use of fuel (city gas, bunker A, diesel oil) in properties excluding tenant-managed properties ("owner-managed properties"). Scope 2: CO2 emissions from the use of purchased electricity and heat (electricity, cool water, warm water, steam, other hot water) in owner-managed properties. Emissions calculated based on tenants' energy consumption using the total floor area and tenants' exclusive area ("tenants' energy-derived CO2 emissions") are excluded from the calculation. Scope 3: CO2 emissions from tenant energy consumption. For owner-managed properties, the total floor area and exclusive area for tenants are used to calculate tenant energy-derived CO2 emissions. - Non-fossil fuel certificate
NBF has been sourcing its real CO2-free electricity together with a non-fossil fuel certificate.
- The definitions of Scope 1, 2, and 3
- Water consumption
Total water consumption=Σ (Purchased water consumption*1 + Other water consumption*2)- Purchased water consists of purchased clean water and industrial water among other things.
- Other water consists of water recycled inside the property, grand water, rainwater among other things.
- Waste emissions
Total waste emissions=Σ (General waste emissions*1 + Industrial waste emissions)
Based on the “Waste Management and Public Cleansing Act”- Out of the 71 properties subject to the calculation of general waste emissions, the scope covered by the assurance includes 45 properties calculated using one of the following measurement methods: ① Measurement by meters within individual properties, ② Measurement by waste collection contractors, ③ Measurement by garbage bags (weight conversion based on documented agreements).
- Intensity figures
Each intensity figure = Total consumption of each / Floor space
Floor space is based on area under the Building Standards Act.
Intensity figures are corrected by annual average occupancy rate.
Corrected intensity figures = Non-Corrected Intensity Figures / Average vacancy rate [%]
Calculations of energy consumption intensity and CO2 emission intensity are based on the energy consumption and CO2 emissions that reflect the non-fossil fuel certificate utilization.
※Some variance come from rounding off.